Centrum Good To Great Strategy
Long term outperformance
Delivery of a net positive or a ‘real’ return over a reasonable time frame
Key takeaways
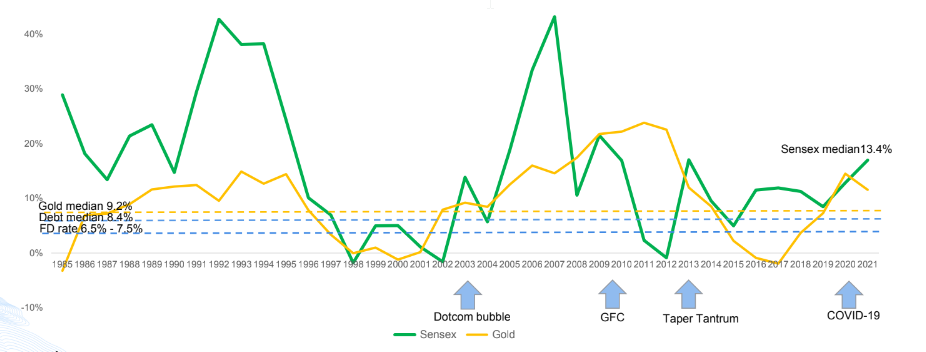
- 5Y rolling return: Sensex (proxy for equity) is greater at 13.4% vs 9.2% by Gold vs 8.4% by debt funds vs 6.5%-7.5% FDs
- The 5Y CAGR Sensex return has turned negative thrice in the past 35 years
- The maximum drawdown range observed in a 5 Year holding period was between 2 to 4%
- The ‘post-crisis’ recovery Sensex 5Y return CAGR is generally much higher than returns from Gold
Actively managed funds outperform
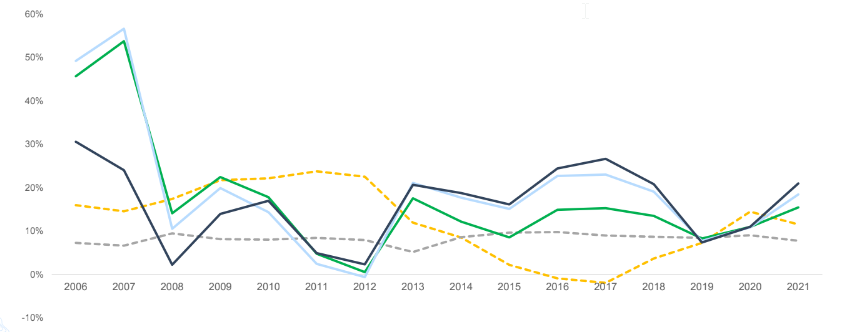
Within the equities asset class, alpha has been delivered by active fund managers
Key takeaways
- 15 Year median returns : Equities 13%
- Actively Managed Funds : Large-cap 15%; Mid-cap 19%; Small-cap 17%
Centrum PMS: Mid and small cap performance
Our mid-cap/small-cap strategy has built a strong track record over the last 9.5 years

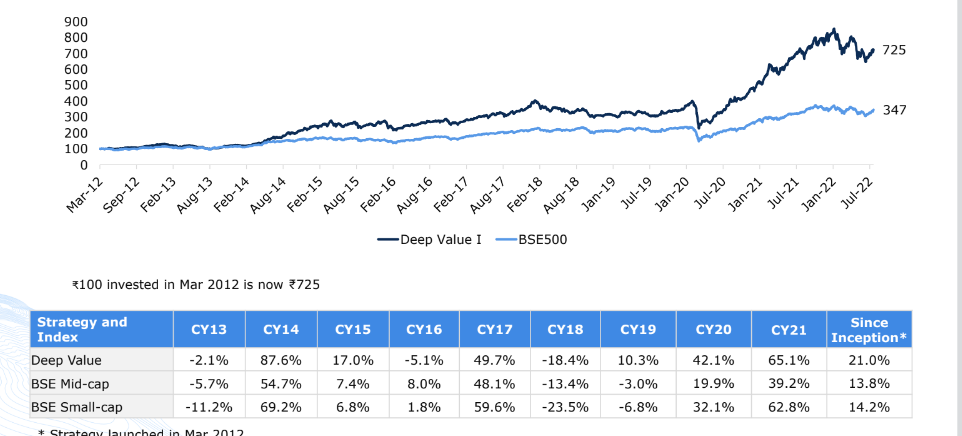
Centrum PMS Deep value (DV) strategy has a track record of more than 9 years. It has outperformed debt and gold as an asset class. DV has also outperformed the peer group/category of similar mutual funds.
Portfolio construction strategy
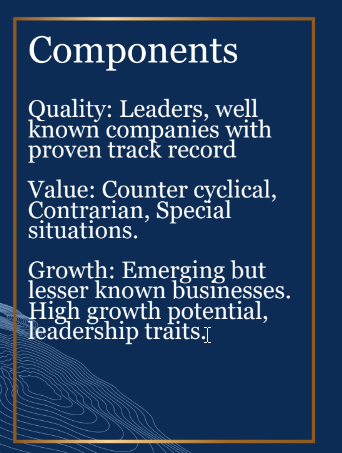
Multilayered risk management process
Robust guide rails which combine ‘inside out’ with ‘outside in’ perspectives
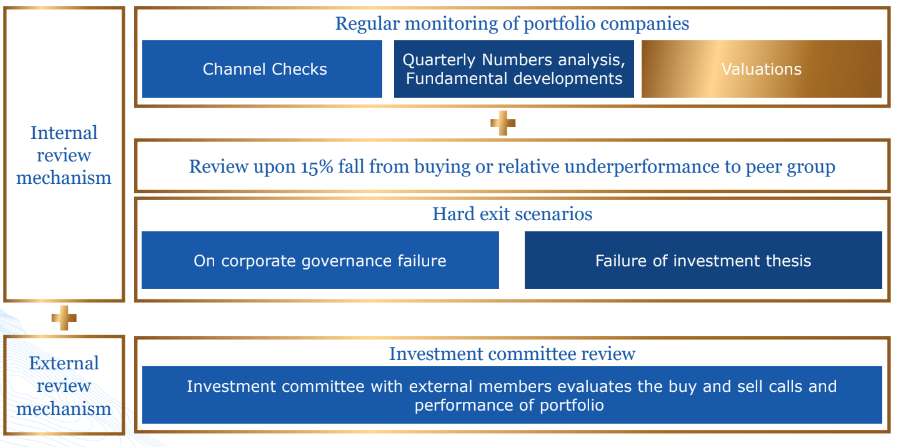
Portfolio performance – near term
Performance versus benchmark
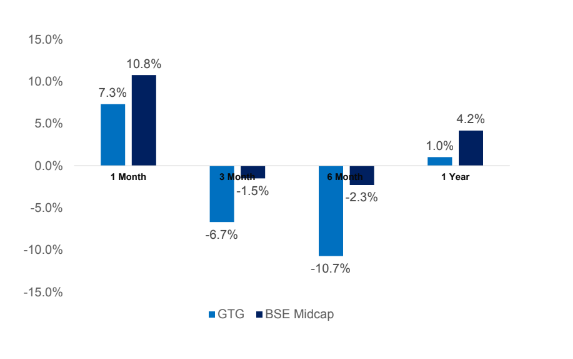
Portfolio composition and market cap exposure
Portfolio performance – long term
The Deep Value strategy delivered 21% CAGR since inception (net of fees) over the last ~10 years
Portfolio analytics – Good to Great
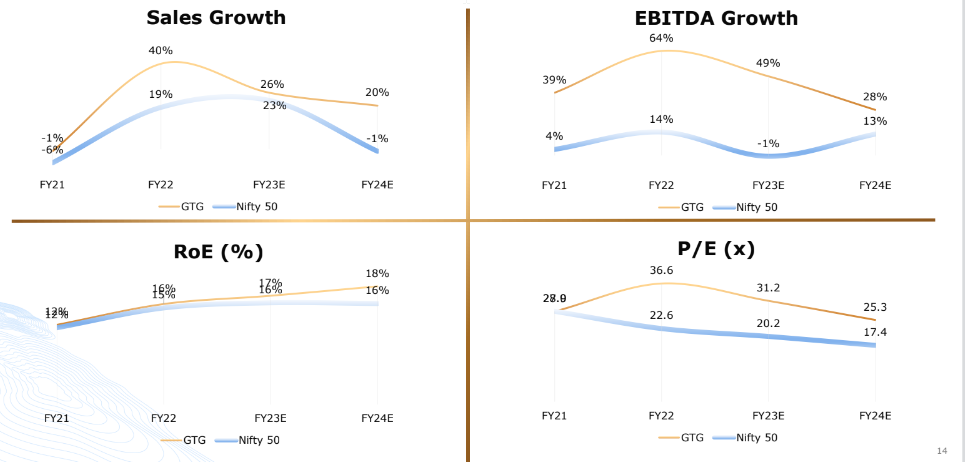
Comparisons with the market (Nifty 50) on key metrics
Portfolio analytics – Good to Great
Comparisons with the market (Nifty 50) on key metrics

Growth rate is higher and RoCE is superior. Debt is negligible at portfolio level
Early Identification Success stories
APL Apollo
Leading building material player
- Rapid growth: Last six years sales volume CAGR stands at 18.5%, despite weak economic conditions. Consistently gaining market share: from 29% in FY16 to 36% in FY19
- Thought leadership: Innovated the use of hollow sections (structural steel) for construction sector in India. Built a B2C distribution network for steel products. Has 790 distributors and 50,000 retailers.
- Technology leadership: Introduced direct forming technology (DFT) and In-line Galvanising technology (TRICOAT)
- Best-in-class working capital metrics: Down from 47 days in FY16 to only 28 days in FY19. Profitable : Consistently delivering C.20% RoCE in past four years while spending heavily on growth capex.
- Attractive valuation: ~15x FY20E
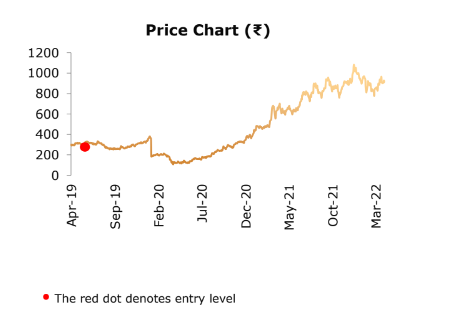
- Institutional holding trend: Our first buying in the DV/GTG portfolio was at levels of ₹1,560 in May’19 when 9 mutual funds held 12% stake all put together; Currently 11 mutual funds hold ~11%.
Muthoot Finance
Dominant Gold Financier
- Highest safety: Gold is safest security, easily saleable and lying in company vaults; Highest profitability – one of the highest RoEs observed amongst all Indian NBFCs.
- Conservative credit approach: Loans have been growing in mid-teens, thereby avoiding risk with Highest promoter holding – With 74% promoter ownership, excessive risk-taking is naturally curbed
- Impeccable operating metrics: Vastly better revenue per branch, revenue per employee and profit per employee compared to the next largest player
- Comfortable valuation: Despite being a leader in its category, trades much cheaper relative to other NBFCs
- Growing in a tough environment: While most other NBFCs are de-growing their loan-book, Muthoot is growing rapidly with attractive valuation
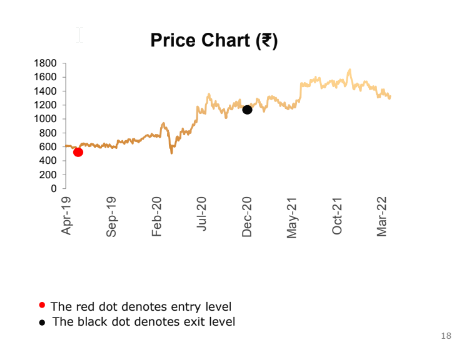
- Institutional holding trend: Our first buying in the DV/GTG portfolio was at levels of ₹580 in May’19 when 16 mutual funds held less than 9% stake all put together; Currently 27 mutual funds hold ~6%.
Granules India
API/Formulation opportunity
- Scale: World’s largest paracetamol and granulation facility, leading to global cost leadership
- Stable business: Older generation drugs face lesser competition, while growing at ~17% for the past several years
- Consistently gaining market share: Came from behind to become India’s leading Metformin exporter
- Rising margins: EBITDA margin grew from 12% in FY11 to 17% in FY19 and is expected to cross 20%
- Healthy balance sheet: 19x interest cover with completion of major capex cycle in FY20
- Attractive valuation: at ~12x FY20E
- Institutional holding trend: Our first buying in the DV/GTG portfolio was at levels of ₹92 in Aug’19 when mutual fund holding was negligible. Currently 3 mutual funds hold ~0.1%
Max Healthcare
Important to book profits
- Our investment thesis was based on sum-of-the-parts, since the stock was suffering from ‘HOLDCO discount’. We felt the demerged and re-listed companies would be worth much more than the holding company valuation.
- The stock was considered Max because of its value unlocking potential (Special Situation), besides its leadership position in the healthcare segment, superior operating matrix (highest ARPOB per day and EBITDA per bed).
- We had bought MAX India Ltd (the holding company of two independent businesses - Max Hospitals and Advaita Senior living) at a price of ~Rs.60. Post de-merger and re-listing, Max Healthcare price crossed Rs100. This seemed like a stiff valuation to us, and we decided to book profits. The residual business (Advaita Senior Living) is now part of Max India Ltd. that got listed now and is trading at Rs60. But we are happy to report that we have realised a gain by exiting Max Healthcare Institute, while the Advaita shares (now Max India) are part of unrealised gains from the transaction.
- We are still holding senior living business – Max India and we will take a view on it. In toto, this deal has delivered ~90% return (realised and unrealised taken together).
Exits and avoids
KRBL
Timely exit prevents a large drawdown
- One of the companies independent directors was accused of having links with an individual who was involved in money laundering as part of the Agusta Westland case.
- Money was indirectly transferred by the said independent director to different entities that were indirectly related to the scam accused. Moreover, he was also allegedly trading shares of KRBL
- We immediately decided to exit our positions and next day executed first thing to protect our portfolio from major drawdowns. As a result, we could exit at ~Rs410. As of today, the stock is down 30% from the level we sold.
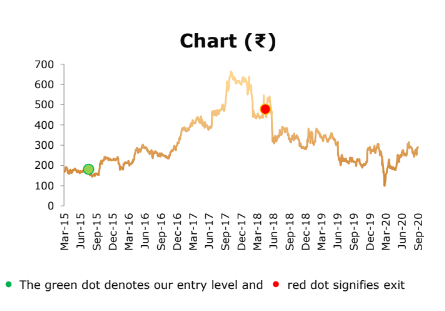
IEX
Early exit given the possibility of regulatory risk Regulator CERC came out with a draft bill which proposed common price discovery (market coupling mechanism). This was a big negative, since efficient price discovery is the key factor behind IEX’s success. If price becomes uniform across different exchanges, IEX’s prime positioning would get severely dented. We took a cue from Europe where after introduction of market coupling new players like EEX gained significant market share and increased competition.
- CERC also proposed to regulate pricing on exchanges which may pose risk to margins
- Also new CEO Rajiv Srivastava, earlier COO of HP India, who joined in Jun 2019 resigned in August 2020 and therefore created overhang on operations in near term
- We decided to exit IEX given these uncertainties
