Risk Metrics in Action- Evaluating Indian Portfolio Management Services Using Risk Analysis Ratios
PMSs have aided in the wealth accumulation of investors leading to the growth of the Indian economy. The finance sector and consequently PMSs have grown immensely over the past few years and have proven to be of paramount importance especially to high net worth individuals for wealth generation.
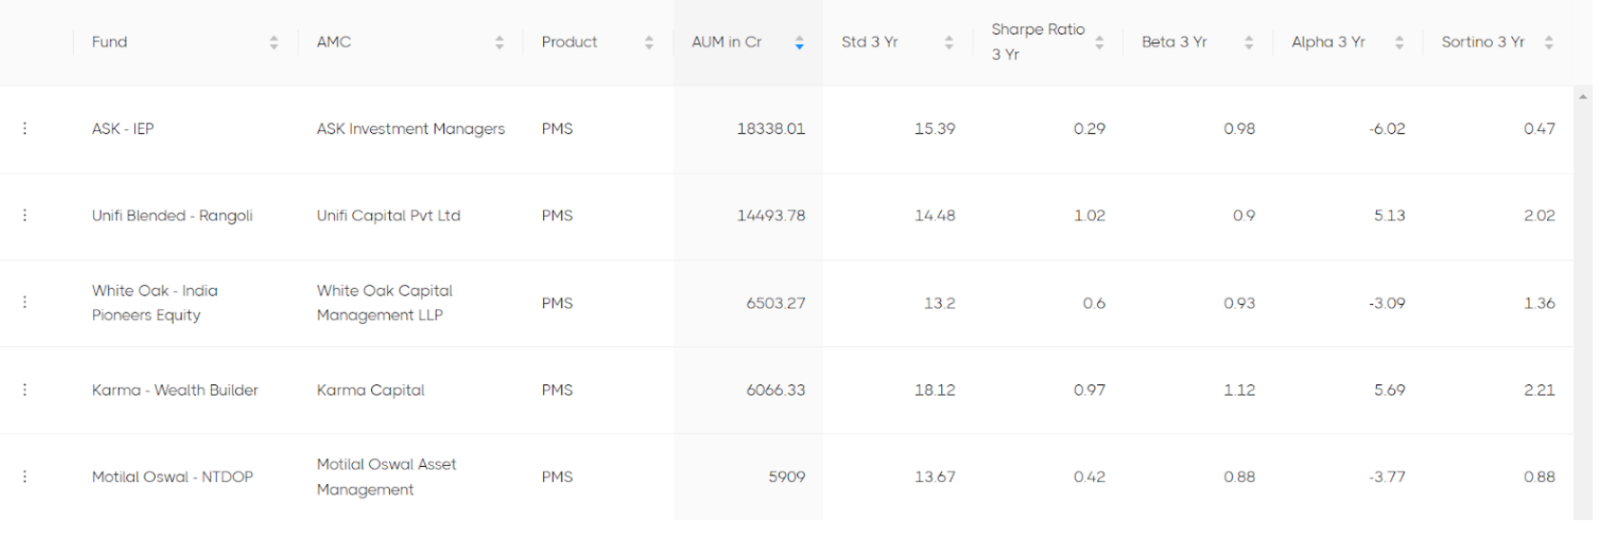
The top PMSs in India have different approaches and strategies when it comes to investing. This also means a different risk level for each one. To gain a better understanding of some of the top PMSs in the country (arranged by AUM in Cr), we can compare them on the basis of risk analysis ratios like Standard Deviation, Sharpe ratio, Beta, Alpha and Sortino.
- Standard deviation is the statistical measure of market volatility, measuring how widely prices are dispersed from the average price. If prices do not fluctuate much, the standard deviation will be low, indicating low volatility. However, if prices swing wildly up and down, then standard deviation returns a high value, indicating high volatility.
- The Sharpe ratio compares the return of an investment with its risk. It's a mathematical expression of the insight that excess returns over a period of time may signify more volatility and risk, rather than investing skill.
- Beta is a value that measures the fluctuations of a stock to changes in the overall stock market. Beta calculation is done by regression analysis which shows security's response with that of the market.
- Alpha is a measure of an investment's performance on a risk-adjusted basis. It takes the volatility (price risk) of a security or fund portfolio and compares its risk-adjusted performance to a benchmark index.
- The Sortino ratio measures the risk-adjusted return of an investment asset, portfolio, or strategy. It takes an asset or portfolio's return and subtracts the risk-free rate, and then divides that amount by the asset's downside deviation.

- According to standard deviation, White Oak Capital Management LLP has the lowest value of 13.2, indicating lowest volatility out of the 5. However, Karma Capital shows the highest SD out of the 5 which is 5.72. This shows high volatility and movement in NAV.
- Going by Sharpe ratio, Unifi Capital Pvt Ltd shows a relatively high ratio of 1.02 which is considered moderate as per the sharpe ratio scale. This means that the fund is generating high returns from an investment. The lowest sharpe ratio belongs to ASK Investment Managers of 0.29. This shows that the fund is generating low returns on investments.
- According to Beta, Karma Capital shows the highest value of 1.12. This indicates that the fund is more volatile than the market and carries more risk but has the potential for higher returns. Motilal Oswal Asset Management has a low value of 0.88, indicating that the fund is not very volatile, but will also yield lower returns in comparison.
- A positive alpha indicates that the fund outperformed or exceeded its respective benchmark. Karma Capital has the highest alpha value of 5.69, indicating that it outperformed by 5.69%. However a low alpha of -6.02 belonging to ASK Investment Managers indicates that it underperformed its benchmark by 6.02%.
- The higher the Sortino ratio, the greater the expected risk-adjusted returns. Karma Capital has a high sortino of 2.21, which indicates that the fund is offering a higher return per unit of downside risk. However, ASK Investment Managers has a low sortino ratio of 0.47, which indicates that the PMS is offering lower returns per unit of negative risk that the investor endures.
All these funds are different in investment approaches and strategies, and hence have contrasting risk ratios. Investors must choose the right combination of all these ratios that best suit their risk appetite and investment goals to ultimately find the right fund to invest their money in.


