Finance
Risk Metrics Unveiled- The Importance of Ratios in Investment Analysis
Risk analysis ratios are financial metrics used by investors, analysts, and managers to assess the risk level of a company. These ratios help in evaluating the likelihood of a company facing financial problems or bankruptcy and assist in making informed investment decisions.
Standard Deviation:
- It measures the dispersion of a dataset relative to its mean. In finance, it's often used as a measure of the risk associated with a particular investment. A higher standard deviation indicates that the values are spread out over a wider range, implying higher volatility and potentially higher risk.
- Higher volatility might not always be favourable to the investors as some might use them to capitalise on higher gains in the later years.
- While standard deviation itself isn’t usually referred to as a “ratio”, it can be considered as one component of various risk ratios or metrics as it simply measures the spread or variation occurring in any given data set of the company. For example, a higher SD value in the prices of a stock might indicate higher variation, and in turn, higher volatility indicating some risk while investing.
Sharpe Ratio:
- This is a tool widely used in finance and investing to measure the risk-adjusted return of an investment as compared to its volatility.
- The Sharpe ratio calculates how much excess return of an investment is obtained(i.e., the return over and above the risk-free rate) by enduring an excess unit of its volatility or risk (measured by the standard deviation of its returns).

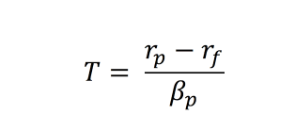
Rp = Return on portfolio, Rf = Risk Free Rate of Return, σp = Portfolio Standard Deviation
- A higher Sharpe ratio indicates a better risk-adjusted return. In other words, it suggests that the investment has generated more return per unit of risk.
- However, the sharpe ratio can be deceptive sometimes if considered on its own. For example, in a hypothetical scenario where, Investment Z, yields modest returns of 7% but has a very low standard deviation of 3%. This results in a Sharpe Ratio of 1.33, which appears better compared to other investments. However, a 7% return might not be very appealing for some investors. This is a problem of investment performance being relative to everyone, which is why the sharpe ratio should not be used on its own.
Beta:
- Beta is a measure of the volatility, or systematic risk, of a security or a portfolio in comparison to the market as a whole.
- A Beta greater than 1 indicates that the asset's price is more volatile than the market, while a Beta less than 1 suggests less volatility.
- Beta is fundamental in the risk assessment and management process, providing a concise measure of a security's sensitivity with respect to market movements.
- Beta is also useful in portfolio management. Investors can adjust their portfolio's beta by including assets with different betas. For example, adding assets with betas less than 1 can reduce the portfolio's overall volatility, while adding assets with betas greater than 1 can increase the portfolio's potential return but also its risk.
Information Ratio:
- The Information Ratio (IR) is a quantitative measure used to measure the performance of an investment portfolio or financial asset as compared to a benchmark index, while also considering the volatility.
- The Information Ratio serves as a valuable tool for both investors and fund managers. It helps them make well-informed decisions by providing insights into a portfolio's performance relative to a benchmark, considering consistency and risk-adjusted returns.
- For fund managers, the Information Ratio serves as a measure of performance that shows if their investments have outperformed a benchmark index consistently. A higher Information Ratio indicates better and more consistent performance, increasing the reputation of the fund manager.

- To calculate IR, subtract the total of the portfolio return for a given period from the total return of the tracked benchmark index. Divide the result by the tracking error.
- Both the information ratio and the sharpe ratio are similar in their application, but are different in methodology. The Information Ratio measures the excess returns relative to a benchmark index, accounting for the tracking error. Whereas the Sharpe Ratio compares the excess returns to a risk-free rate of return, dividing the result by the standard deviation.
Sortino:
- A downside risk is a potential loss from your investment. Conversely, a potential financial gain is known as an upside risk. Unfortunately, many performance metrics fail to account for the variation in the risk of an investment. They merely calculate their rates of return. But not so with the Sortino ratio.The Sortino ratio is a risk-adjustment metric used to determine the additional return for each unit of downside risk.
- It is a refinement of the Sharpe ratio but only penalises the returns, which have downside risks.

- The unique aspect about the sortino ratio is that it defines the difference between upside and downward risks. More specifically, it provides an accurate rate of return, given the likelihood of downside risk, while the Sharpe ratio treats both upside and downside risks equally.


